How to Perform Market Basket Analysis for a Business without Physical Products


How to analyze a market basket when there is none
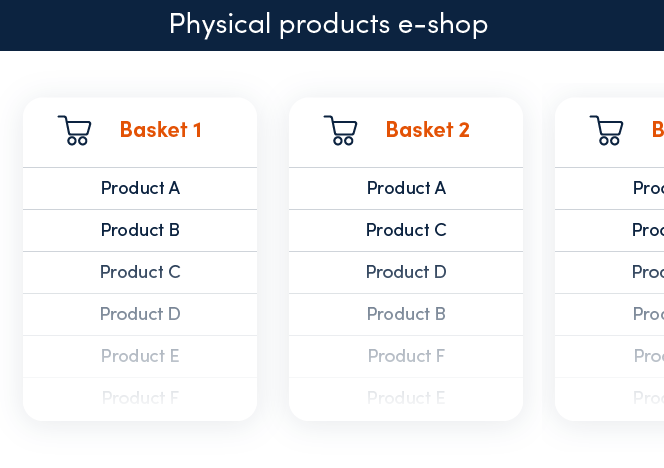
The definition of a market basket is usually quite straightforward. Imagine what the process is when you visit your favorite e-shop: You go shopping on the e-shop’s web pages, check various products, put your chosen ones into a basket and, in the end, confirm the whole basket by checking out and placing your order. In such a case one (market) basket is equal to one unique order. Afterward, Market Basket Analysis is focused exactly on these unique baskets/orders.
Picture 1 – Visualization of sales history of one specific customer
But how to approach Market Basket Analysis when your business is not based on unique baskets/orders and there is a need to consolidate more, different products? For example, because of the industry, your business is in, the products that you sell may not have a physical form at all. Such products can take the form of financial products, insurance, medical services, technical support, or simply any other kind of “service” to customers. More services cannot be wrapped into one single basket because the customer buys them one by one at separate times, not as product bundling at one given moment. Usually, there is also no clear connection between the sales records in the company IT system, dataset, or data warehouse (DWH).
As an example, for a financial brokerage company, the common combinations which were often sold closely together were mortgage and real estate insurance or life insurance and mutual fund investment. The time difference in sales can also be caused by different lengths of the sales cycle for the specific products.
Market Basket Analysis for a financial services broker
The challenge
Within one of our recent customer analytics projects, we faced the specific situation of a financial services provider that focused on loans, insurance, and investments. Our customer wanted to increase sales and support cross-selling by identifying related products with a high probability of consequent sales. These recommendations should be displayed to the brokers as actions in their CRM system.
It seems like a simple and quick job using Market Basket Analysis to maximize sales, nevertheless, the fundamental challenge appeared immediately because of the nature of financial products they sold – our client didn’t work with the concept of “market baskets”, and there were no obvious related products. It is common for brokers to just sell single products one by one, and the only common attribute connecting various products was the internal number of the customer. So, how can we identify the statistically significant pairings in a market basket?
The solution
After several discussions and alignments with the customer, we decided to utilize the sales timeline and construct dummy market baskets based on the time difference between single purchases.
Imagine that you sold Product A on February 1. Then, you scan the stated period of time e.g., one month, after this sale and check if you sold the same customer another, different product (B).
If you find another sale e.g., you sold Product B on February 15, Product B is placed into the common dummy market basket with Product A, and the products are considered as related. Then, the scanning starts again from the date of sale of Product B with the new stated time frame.
On the contrary, if Product B is sold after the stated time frame passed e.g., on March 10, both sales are placed to separate dummy market baskets and considered as not related. Then, the scanning starts again from the date of sale of Product B.
This approach is used to scan the whole sales history and the single product sales are grouped into unique dummy market baskets. After the removal of market baskets with only one product, the standard process of Market Basket Analysis can continue to identify combinations of products sold together with significant probability.

Picture 2 – Visualization of dummy market basket construction for one specific customer (Time Frame 30 days)
The crucial step, which needs to be deeply analyzed and carefully discussed before the analysis calculation, is to correctly set the scanning time frame (TF). This parameter can significantly influence the Market Basket Analysis performance and output’s reliability. If you select too short a time frame, only a few market baskets can be calculated, and the outputs are distorted and underestimated. If you select too long a time frame, not related sales can be placed into one market basket and the connection between products can be identified incorrectly, which leads to misleading recommendations. Imagine that you would place products sold during the summer together into one market basket with the products sold during the Christmas season. They are probably not related to each other at all. It is necessary to find a balanced time frame, ideally supported by another data analysis. But always a time frame aligned with your customer, which is also in line with the context of your business and process setup.
In our case, we analyzed various lengths of the time frame and compared the results. How many dummy market baskets were created based on it? What is the average length of the market basket? And how many outliers we received. Outlier means market baskets that are too short to cover more than one product or which are inadequately long considering the product’s sale process.
Based on the analysis and discussion with the client we selected a time frame of 30 days because it produced balanced outputs It was adequately long to identify related products. And, simultaneously, it took into account the specifics in the sales process – for example, real estate insurance is contracted in an hour, whereas the mortgage loan approval process can take several weeks.
Summary
Let’s summarize what we are saying. The main question was: “How to increase sales by offering cross-sells using insights from Market Basket Analysis in a company without natural grouping of sold products into single orders (market baskets)?” We introduced an alternative concept based on scanning the sales timeline and grouping sold products into dummy market baskets. Dummy market baskets are calculated with consideration of a time frame between single product sales, which is carefully analyzed and set in cooperation with our customer. This process is suitable and works for a variety of companies without physical products.
Is it suitable for your company? Are there advantages to you using this model? Or do you need to invent another specific approach for Market Basket Analysis appropriate for your business? Get in touch with us at Simplity and improve the way you work with your data.
Subscribe to newsletter
Get the latest news and content from us
